RSI was developed by J. Welles Wilder in 1978 and remains one of the most widely used technical indicators in both stock and crypto markets. It measures the speed and magnitude of recent price changes to evaluate whether an asset is overbought or oversold on a scale of 0 to 100. Despite being nearly 50 years old, RSI remains effective in crypto markets because the human psychology it measures — fear, greed, momentum, and exhaustion — is timeless. Understanding RSI deeply separates traders who use it as a simple line from those who use it for edge.
How RSI Is Calculated
How RSI Is Calculated
RSI compares the average gains to average losses over a look-back period (default 14 candles). The formula: RSI = 100 − [100 / (1 + RS)], where RS = Average Gain / Average Loss over the 14-period window. A result close to 100 means price only went up in recent periods; close to 0 means only down. The 14-period default was Wilder's original recommendation for daily stock charts — and it has transferred remarkably well to crypto's 24/7 candlestick charts.
You don't need to calculate RSI manually — every charting platform (TradingView, Binance, Kraken Pro, ThinkorSwim) has it built-in. What matters is understanding what the resulting number tells you and, more importantly, what its behavior pattern means in context. RSI is a lagging indicator (based on past prices) but its divergence signals are genuinely leading indicators when used correctly.
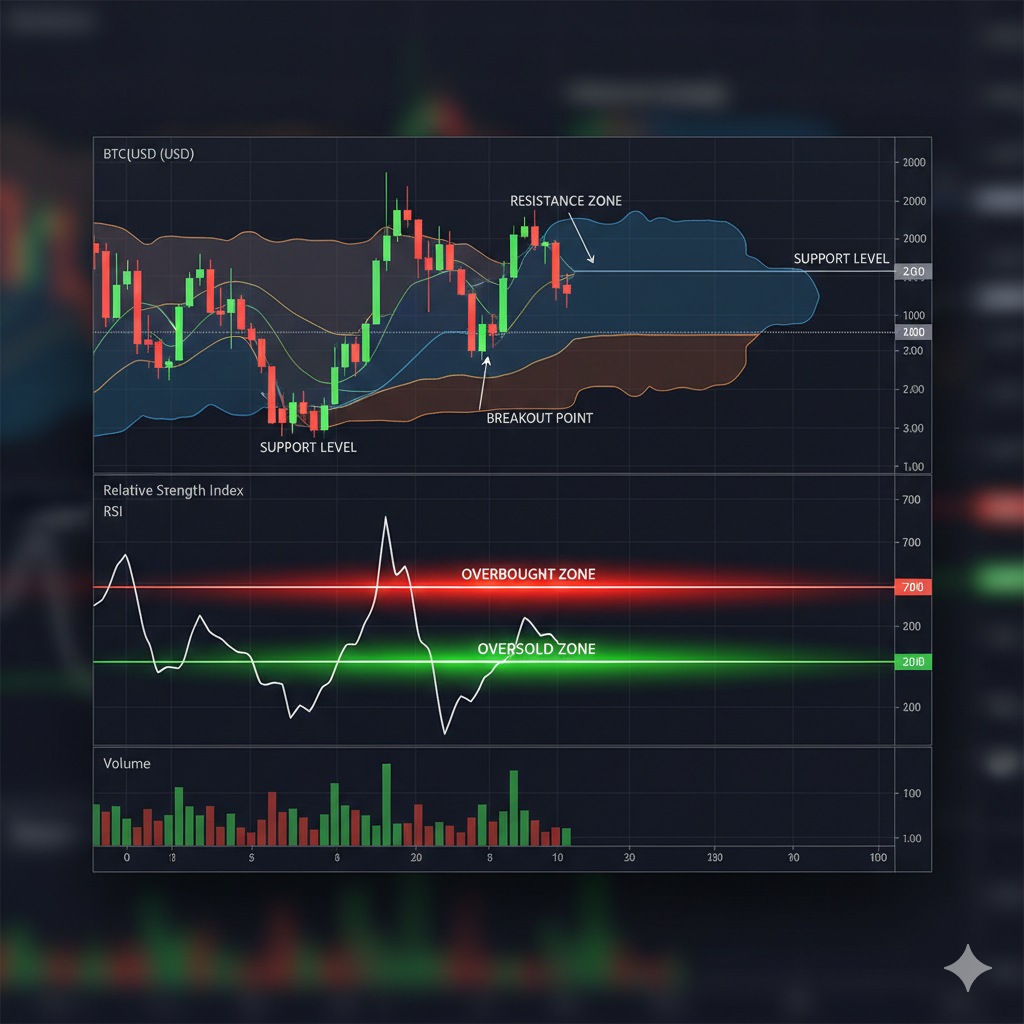
The interpretation thresholds matter more than the raw number: standard thresholds are 70 (overbought) and 30 (oversold). But in crypto's high-volatility environment, many experienced traders adjust these to 80/20 or even 80/25 to filter false signals in strong trending markets. Bitcoin during a bull run can sustain RSI above 70 for weeks — a 'sell' signal at 70 in that context would have caused traders to miss the majority of the move.
RSI Trading Strategies
RSI Trading Strategies

Classic Overbought/Oversold
RSI above 70: overbought → potential sell or avoid entries. RSI below 30: oversold → potential buy or look for reversal signals. Warning: in strong trends, RSI can stay overbought (>70) for extended periods. During Bitcoin's 2020–2021 bull run, RSI remained above 70 for multiple months — traders who sold on every RSI 70 touch massively underperformed. In ranging markets, overbought/oversold is reliable. In trending markets, treat it as a caution signal rather than a definitive reversal trigger.
RSI Divergence (Most Powerful Signal)
Bullish Divergence: price makes a lower low, RSI makes a higher low → momentum is weakening even as price falls, suggesting potential reversal upward. Classic entry: buy when price tests the second low with RSI showing the higher low, with stop below the low. Bearish Divergence: price makes a higher high, RSI makes a lower high → fading momentum near resistance, potential reversal down. Divergence is the most reliable RSI signal because it captures the disconnect between price action and underlying buying/selling momentum — often visible before any price reversal occurs.
RSI 50 Centerline Crossover
RSI above 50 = bullish momentum. Below 50 = bearish momentum. RSI crossing from below 50 to above 50 with a rising moving average confirmation is often a reliable trend change signal. Many professional traders use RSI 50 crossovers on the daily chart as primary trend filters: only take long trades when daily RSI > 50, only take short trades when daily RSI < 50. Simple but statistically robust across backtesting.
Advanced RSI Techniques
Advanced RSI Techniques
RSI Range Theory (Wilder's original concept): in bullish trends, RSI typically oscillates between 40 and 90, with the 40 level acting as support. In bearish trends, RSI typically oscillates between 10 and 60, with 60 acting as resistance. Tracking which 'range' RSI is operating in tells you more about market phase than any single overbought/oversold reading. When RSI breaks above its bearish range ceiling (60) with conviction, it's one of the strongest early bull market signals available from a single indicator.
- ✓Hidden Bullish Divergence: higher low in price + lower low in RSI = continuation signal in uptrend
- ✓RSI Failure Swing: RSI peaks below 70, falls, rallies but fails to exceed prior peak = bearish
- ✓RSI Range Shift: in bull markets, RSI oscillates 40–90; in bear markets, 10–60 — track the range
- ✓RSI Multi-Timeframe: if daily RSI < 50 and 4H RSI > 70, 4H setup is counter-trend — lower win rate
- ✓Volume confirmation: RSI divergence with volume spike in the reversal direction is highest probability
- ✓Wilder Smoothing: RSI uses a Wilder smoothed MA (equivalent to EMA-27), making it slower than raw EMA
RSI for XRP and Bitcoin Specifically
RSI for XRP and Bitcoin Specifically
Bitcoin's RSI behavior differs by cycle phase: during accumulation (post-bear, pre-bull), RSI oscillates in a narrow 35–65 range with low volatility. The expansion from this narrow range — RSI breaking above 65 with increased volatility — is often the earliest measurable signal of a new bull market beginning. Bitcoin's November 2023 RSI range shift (breaking decisively above 60 monthly) preceded the 2024 bull run by several months.
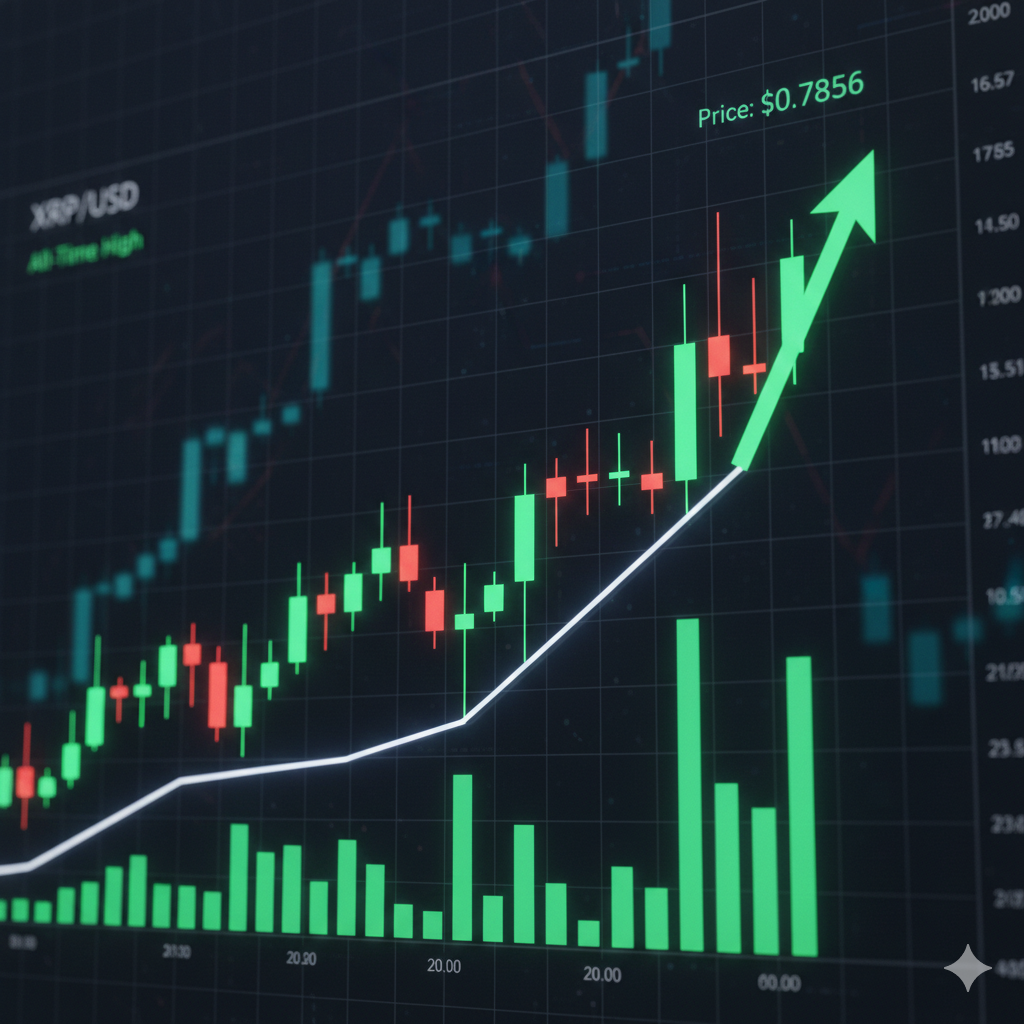
XRP's RSI shows distinctive behavior during legal/regulatory events: the SEC lawsuit filing in December 2020 caused XRP RSI to drop to 20 (extreme oversold) despite being in a bull market. This type of externally-forced oversold RSI reading on a fundamentally strong asset represents a high-probability long-term entry. Post-lawsuit resolution, XRP's RSI returned to normal bull market behavior, oscillating 40–85 range.
RSI FAQs
Indicators Can't Tell You About Tomorrow's XRP Earnings
For passive, guaranteed-direction crypto income, cloud mining beats waiting for RSI signals. Earn daily XRP on MineXrpOnline — no chart watching required.
Start Passive Mining