Created by Gerald Appel in the late 1970s, MACD combines the power of trend-following moving averages with momentum measurement. It answers two crucial questions: is the current trend bullish or bearish, and is that trend gaining or losing strength?
Understanding MACD Components
Understanding MACD Components
MACD Line
MACD Line = 12-period EMA minus 26-period EMA. When it is above zero, the short-term EMA is above the long-term EMA — bullish momentum. Below zero = bearish momentum. The farther from zero, the stronger the trend.
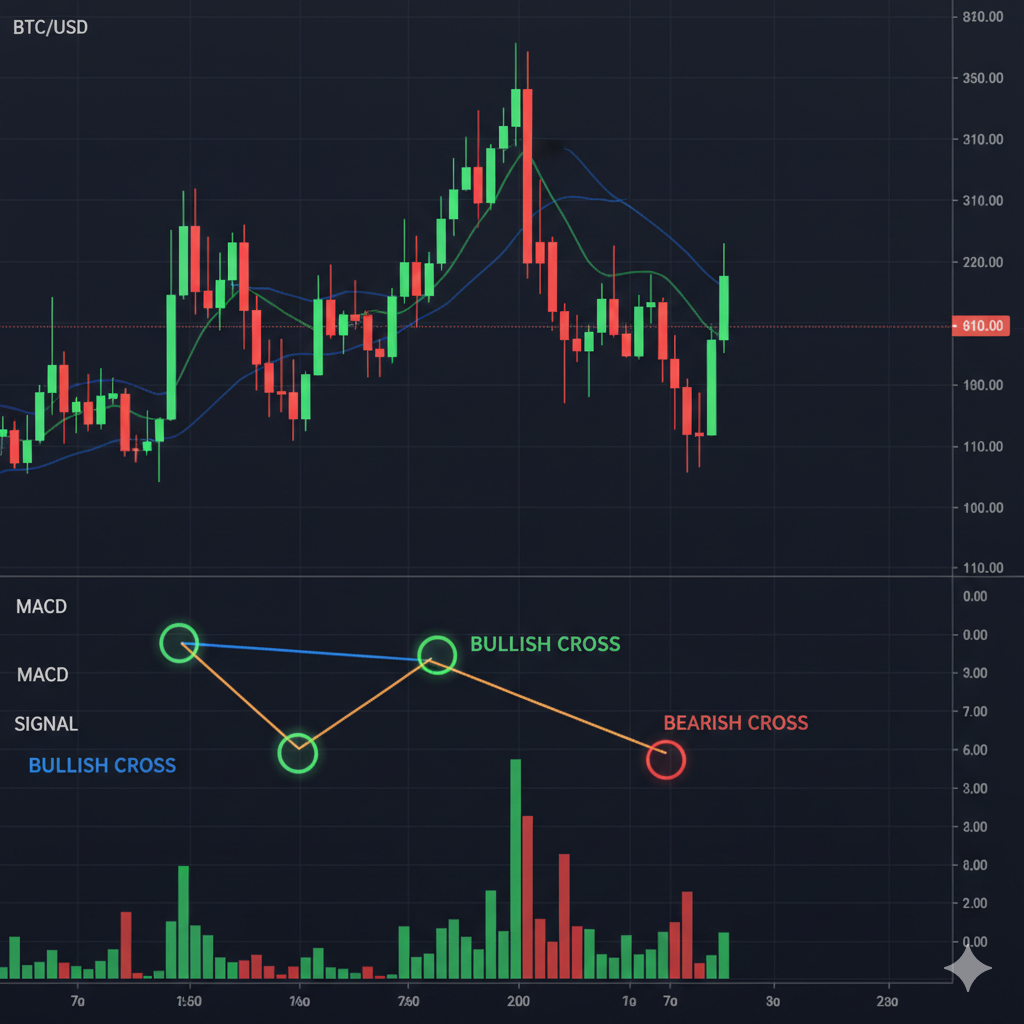
Signal Line
Signal Line = 9-period EMA of the MACD Line. When the MACD Line crosses above the Signal Line (bullish crossover), it's a buy signal. When MACD crosses below Signal (bearish crossover), it's a sell signal. These crossovers are the most widely watched MACD signals.
Histogram
Histogram = MACD Line minus Signal Line. Growing bars = increasing momentum in current direction. Shrinking bars = momentum fading (possible trend change coming). The histogram often provides earlier warning than the actual line crossover.
MACD Divergence: Trading Reversals
MACD Divergence: Trading Reversals

- ✓Bullish Divergence: price lower low + MACD higher low → potential upward reversal
- ✓Bearish Divergence: price higher high + MACD lower high → potential downward reversal
- ✓Most reliable on daily and weekly timeframes
- ✓Combine with key support/resistance levels for higher-probability signals
- ✓Be patient: divergence can persist for several candles before resolving
MACD FAQs
Daily Passive XRP: No MACD Required
Trading with MACD requires discipline, screen time, and risk management. Cloud mining on MineXrpOnline earns daily XRP with zero chart monitoring.
Get Daily XRP