Technical analysis (TA) is the study of historical price and volume data to forecast future market movements. While fundamentals tell you what to buy, technical analysis can help you determine when to buy and where to sell. For crypto's 24/7 markets with high volatility and trend-driven behavior, TA provides a structured framework for decision-making. This guide covers every major tool — from basic candlesticks to advanced patterns — with real cryptocurrency examples.
Candlestick Charts: The Foundation
Candlestick Charts: The Foundation
Candlestick charts display four price points for each time period: open, high, low, and close. The 'body' shows the opening and closing prices; the 'wicks' (shadows) show the highest and lowest price reached. Green bodies = price rose; red bodies = price fell. Learning to read these at a glance is the first skill of any trader.
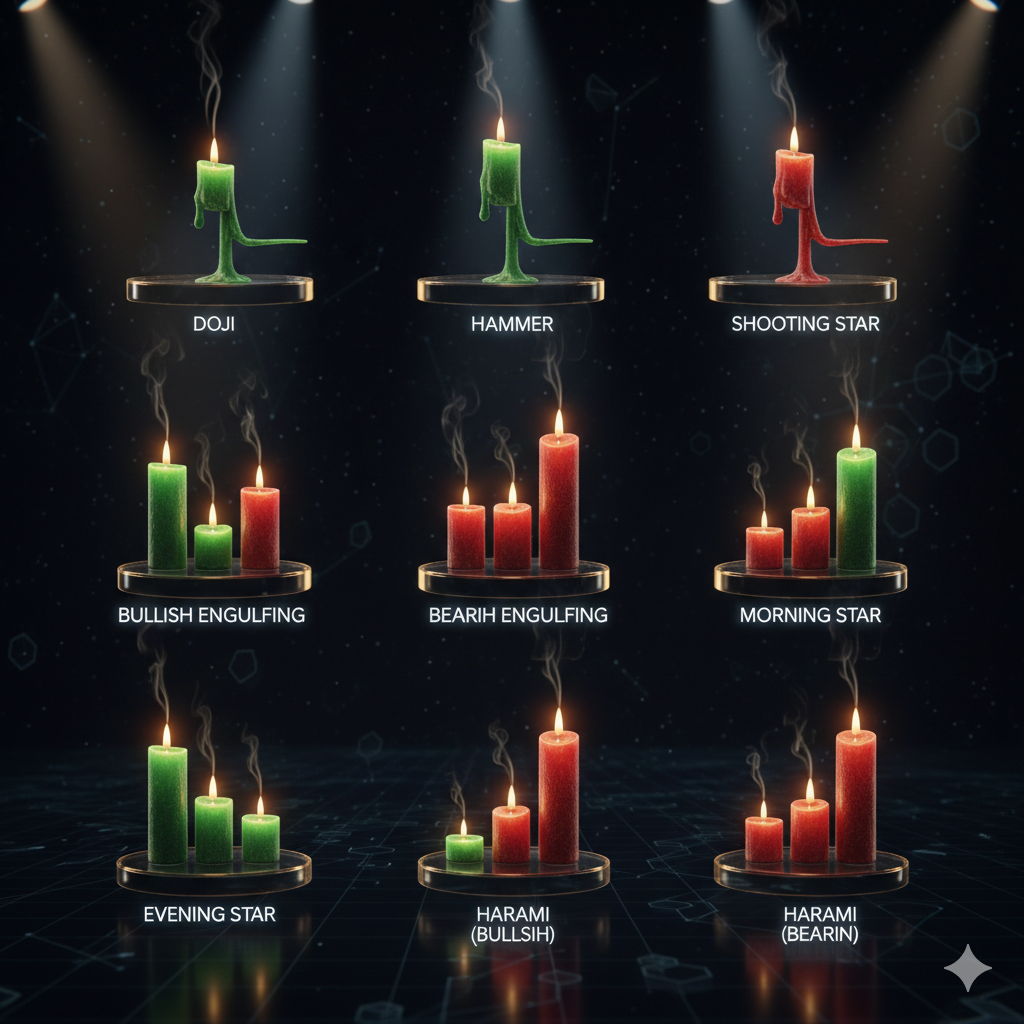
Learning to read individual candle patterns (doji, hammer, shooting star) and multi-candle patterns (engulfing, morning star, bearish harami) gives insight into buyer and seller battles at specific price levels. A doji — where open and close are nearly equal, creating a cross shape — signals indecision and often precedes reversals. A hammer at the bottom of a downtrend suggests buyers are stepping in.
Multi-candle patterns provide stronger signals than single candles. The 'bullish engulfing' pattern — a large green candle completely engulfing the previous red candle's body — is one of the most reliable reversal signals at key support levels. The 'morning star' (three candles: large red, small indecisive, large green) is a powerful bottom reversal pattern used by professional traders.
Core Technical Indicators Deep Dive
Core Technical Indicators Deep Dive

Moving Averages: Trend Direction
The Simple Moving Average (SMA) and Exponential Moving Average (EMA) smooth out price action to reveal the underlying trend. The EMA gives more weight to recent prices — making it more sensitive to new developments. Common crypto setups: 20 EMA (short-term trend), 50 EMA (medium-term trend), 200 MA (long-term trend and major support/resistance). The 'Golden Cross' (50 MA crossing above 200 MA) is one of the most widely-watched bullish signals in Bitcoin analysis.
RSI: Momentum and Overbought/Oversold
The Relative Strength Index (RSI) measures momentum on a 0–100 scale. Classic interpretation: below 30 = oversold (potential buying opportunity), above 70 = overbought (potential selling opportunity). RSI divergence — when price makes a new high but RSI makes a lower high — is one of the most powerful reversal signals in crypto. Bitcoin's 2021 top was foreshadowed by bearish RSI divergence months before the price peaked.
MACD: Trend Changes and Momentum
MACD = (12 EMA) - (26 EMA). When the MACD line crosses above the signal line, it's bullish; crossing below is bearish. The histogram shows the magnitude and direction of the crossover. MACD works best for identifying medium-term trend changes and confirming entries after a price breakout, rather than predicting exact tops and bottoms.
Volume: Confirm Every Move
Volume is the most underused indicator. A breakout above resistance on high volume is far more significant than one on low volume — high volume confirms that market participants believe in the move. Rising price with declining volume signals a weakening trend about to reverse. Massive volume spikes on price drops often mark capitulation — the exhaustion of selling pressure before a bottom.
Support and Resistance: The Most Important Concept
Support and Resistance: The Most Important Concept
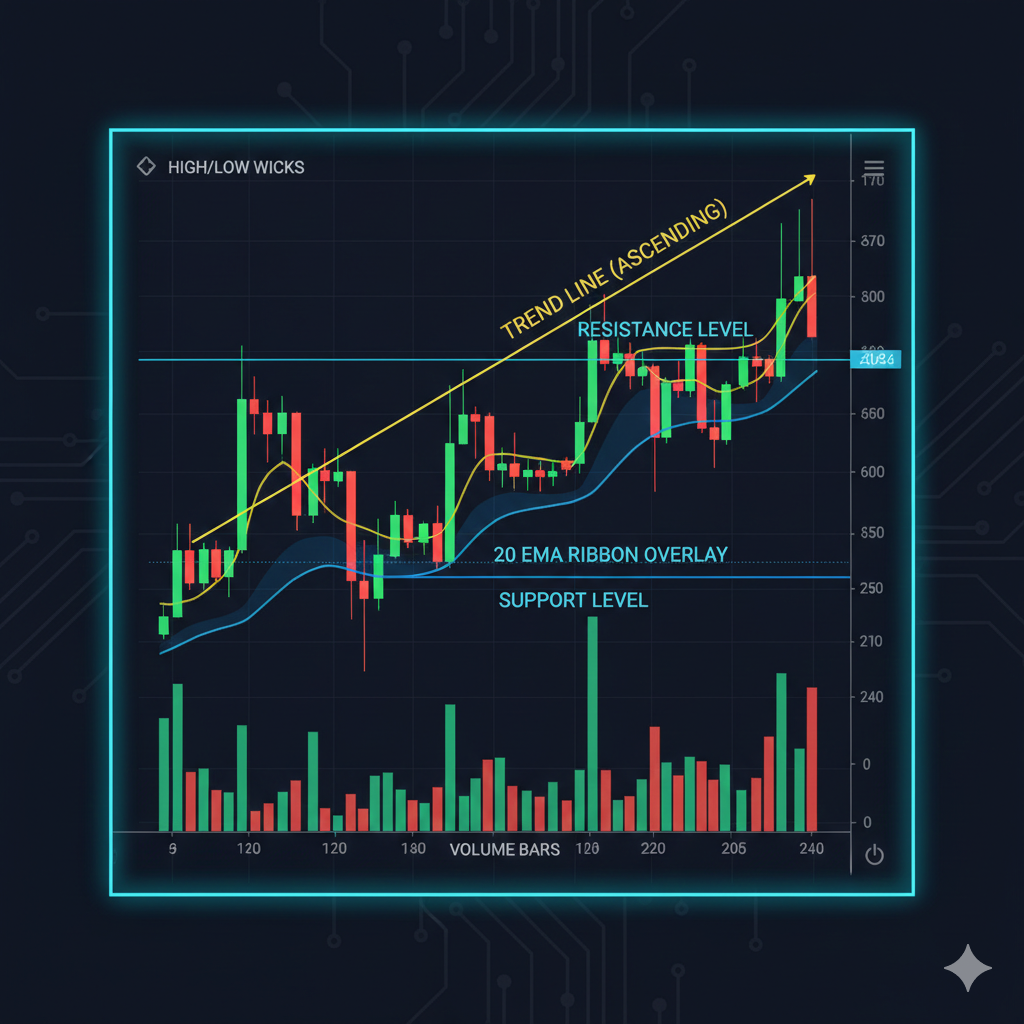
Support and resistance are price levels where buying or selling pressure has historically been strong enough to cause a price reversal. Support is a floor — price tends to bounce at this level because buyers accumulate there. Resistance is a ceiling — price tends to stall or reverse because sellers become active at this level.
The most important principle: broken resistance becomes new support (and vice versa). If Bitcoin breaks above $50,000 resistance on strong volume and retests $50,000 from above, that former resistance level should now act as support. This 'role reversal' concept is the foundation for many professional trading strategies.
Psychological round numbers ($100, $1,000, $10,000, $50,000) often act as support or resistance because large numbers of market participants set limit orders at these levels. For XRP, the $1.00, $2.00, $3.00, and $5.00 levels have all acted as significant psychological support/resistance levels at different points in its market history.
Chart Patterns Every Crypto Trader Must Know
Chart Patterns Every Crypto Trader Must Know
Chart pattern reliability improves significantly with timeframe. A Head and Shoulders pattern on the weekly chart carries much more weight than the same pattern on a 15-minute chart. For trading decisions with meaningful capital, prioritize patterns forming on the daily or weekly timeframe and use lower timeframes only for entry timing.
Pattern failures are equally valuable signals. When a clearly-formed bullish pattern fails — a double bottom break down instead of up — the resulting move is often dramatic because traders positioned for the expected breakout are now forced to exit, amplifying the move in the unexpected direction. Professional traders watch for failed patterns as some of their highest-probability setups.
- ✓Head & Shoulders: bearish reversal — three peaks with middle highest; price target = neckline break minus head height
- ✓Double Top/Bottom: reversal after price fails to break same level twice; confirmed on third touch
- ✓Cup and Handle: bullish continuation after rounded consolidation; breakout target = cup depth added to rim
- ✓Ascending/Descending Triangle: breakout setup with clear price target (triangle height added to breakout level)
- ✓Bull/Bear Flag: brief consolidation within a strong trend — continuation likely on flag breakout
- ✓Rising/Falling Wedge: often reversal patterns at trend extremes; rising wedge is bearish, falling wedge is bullish
Building a Complete TA Trading Framework
Building a Complete TA Trading Framework
Effective TA requires a top-down approach: start with the highest timeframe to understand the macro trend, then drill down for entry. Weekly chart determines bull or bear market context. Daily chart identifies key support/resistance and potential patterns. 4-hour chart provides entry timing. This prevents the most common beginner mistake: fighting the macro trend on a lower timeframe.
Risk management is more important than any indicator. Professional traders define their stop loss before entering any trade — a price level that invalidates their analysis. The standard risk management rule is to risk no more than 1–2% of total capital on any single trade. With a 1% risk rule, even 10 consecutive losing trades only reduces capital by 10%, preserving the ability to recover.
Crypto TA FAQs
No Chart Reading Required for Mining Returns
Technical analysis skills take months to develop. Cloud mining on MineXrpOnline pays daily XRP regardless of whether the chart shows a golden cross or death cross.
Earn Without Chart Analysis