A price chart is a visual record of every trade that has occurred in a market. Learning to read charts doesn't require complex mathematics or years of experience — it requires understanding a few fundamental concepts that unlock the ability to understand market structure and identify potential opportunities.
Candlestick Charts: Reading the Building Blocks
Candlestick Charts: Reading the Building Blocks
The Candlestick Anatomy
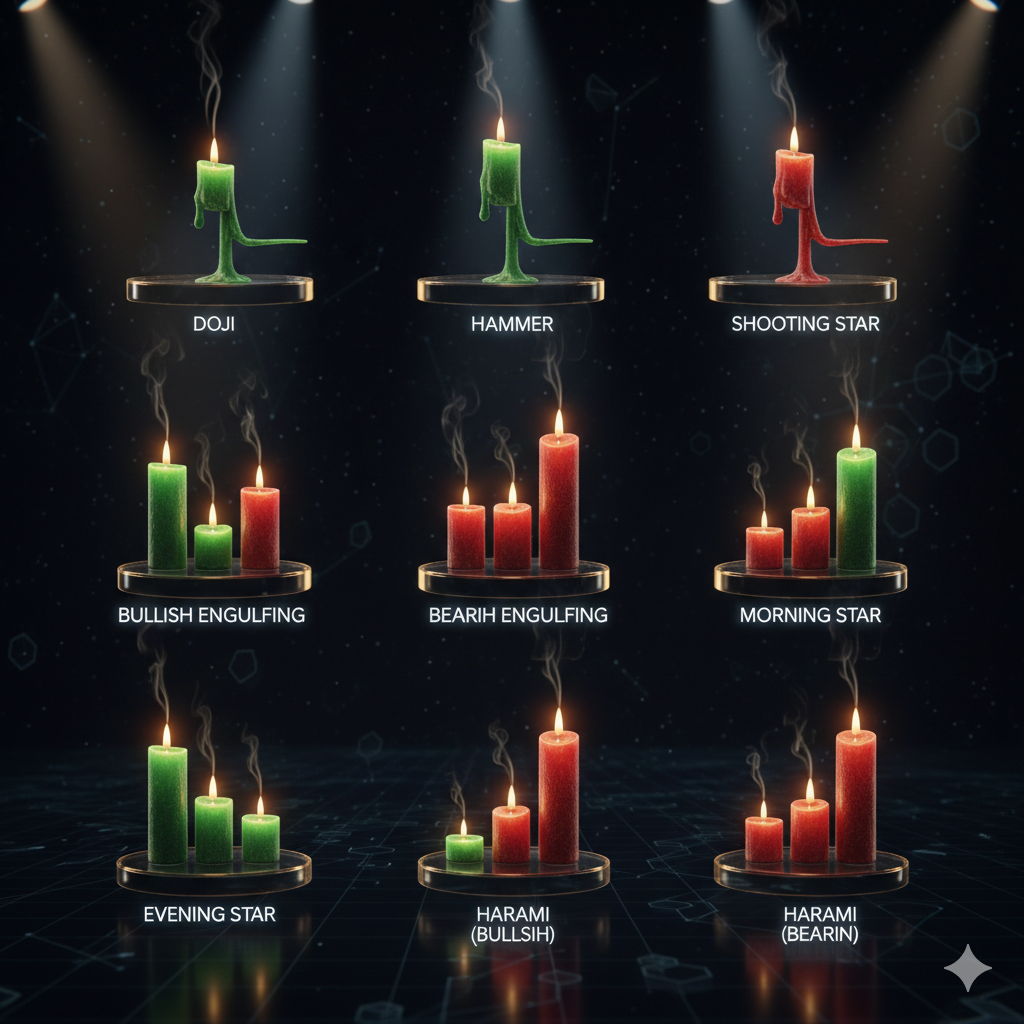
Each candle represents price action over a time period: Open (starting price), Close (ending price), High (highest trade), Low (lowest trade). The body is the rectangle between open and close. Wicks extend above and below to show range extremes. Green candles: close > open (buyers won). Red candles: close < open (sellers won).
Candle Psychology
Large green body with small wicks: buyers dominated the entire period — very bullish. Large red body with small wicks: sellers dominated — very bearish. Small body with large equal wicks: indecision/equilibrium between buyers and sellers. Long wick pointing down on a green candle: buyers rejected lower prices aggressively — bullish reversal signal.
Trend Lines and Market Structure
Trend Lines and Market Structure
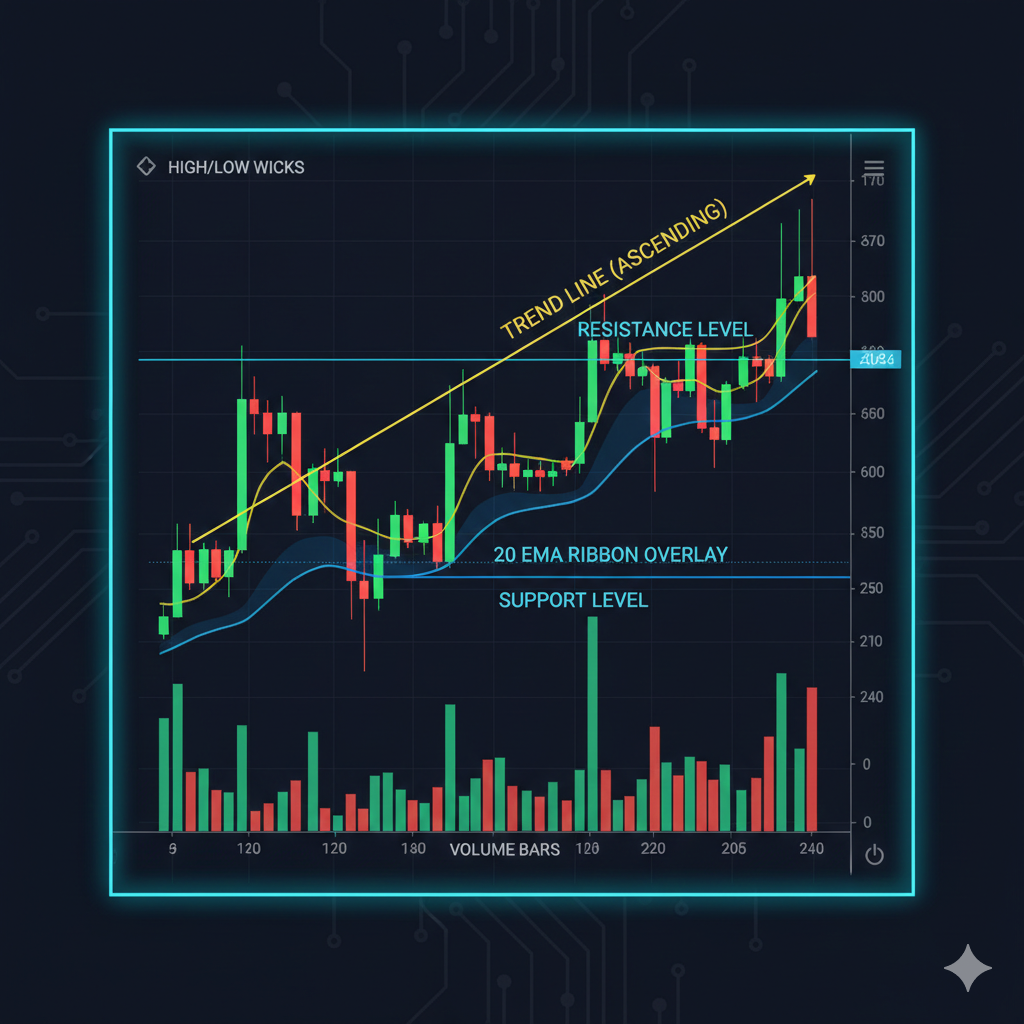
- ✓Uptrend: series of higher highs AND higher lows — confirm before buying
- ✓Downtrend: series of lower highs AND lower lows — avoid catching falling knives
- ✓Draw trend lines connecting at least 3 price points for validity
- ✓Support = price level where buyers historically step in strongly
- ✓Resistance = price level where sellers historically step in strongly
- ✓Trend changes when market structure breaks (new lower high in uptrend)
Three Beginner-Friendly Indicators
Three Beginner-Friendly Indicators
Moving Average (MA/EMA)
Smooths price action by averaging closes over N periods. 20 EMA: short-term trend direction. 50 EMA: medium-term trend. 200 EMA/MA: long-term trend. Price above 200 MA = generally bullish. Golden Cross (50 MA crossing above 200 MA) = bullish structural signal. Death Cross (50 MA below 200 MA) = bearish signal.
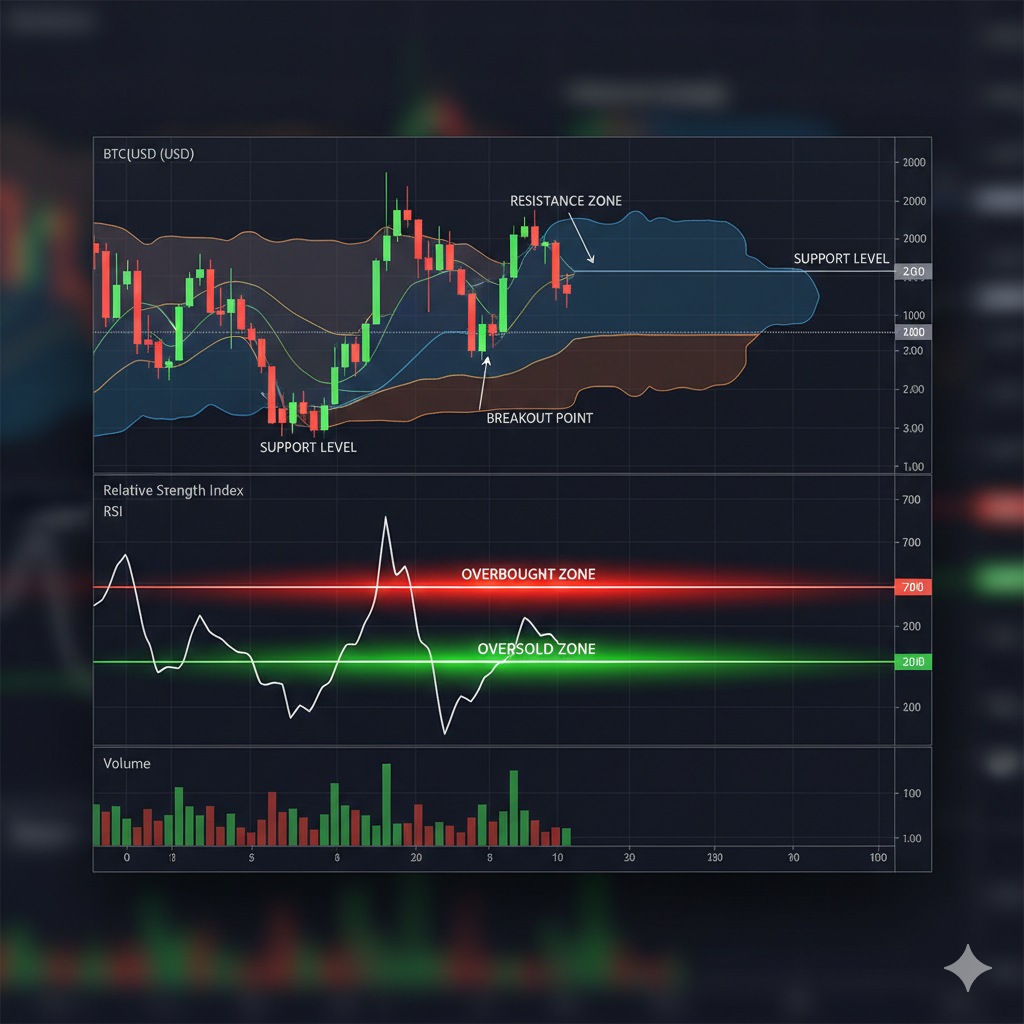
RSI (Relative Strength Index)
Measures momentum on a 0–100 scale. RSI above 70 = overbought (potential pullback). RSI below 30 = oversold (potential bounce). Most useful for identifying extreme conditions and divergences (price making new high but RSI making lower high = bearish divergence).
Volume
Volume is the most reliable confirmation indicator. Price moves with high volume are significant. Price moves with low volume are suspect (potential manipulation or false breakout). Volume rising along with price in an uptrend confirms buyer participation.
Chart Reading FAQs
Build Wealth While You Learn
You don't need to master technical analysis to earn passive XRP income. MineXrpOnline cloud mining accumulates XRP daily while you sharpen your market analysis skills.
Mine While You Learn