The most common mining mistake: buy hardware based on WhatToMine showing current daily profit, without modeling how that profit changes as difficulty increases, hardware ages, and crypto prices fluctuate. In 2021, many buyers purchased $10,000 ASIC miners expecting 6-month payback periods that turned into 36+ month payback periods (or never) as difficulty grew and prices fell. Rigorous profitability analysis requires modeling multiple variables dynamically over time — not just today's snapshot.
The Complete Mining Profitability Formula
Daily gross revenue = (Hashrate / Network Hashrate) × Daily Block Rewards × BTC Price. Example: 100 TH/s in a network with 700 EH/s total (700,000,000 TH/s), earning 450 BTC/day (post-halving) at $70,000/BTC: (100 / 700,000,000) × 450 × $70,000 = $0.45/day. Daily electricity cost = Miner Wattage × Hours × kWh Rate. S21 Pro at 3,510W: 3.51 kW × 24h × $0.05 = $4.21/day. At this calculation, the S21 Pro loses money at $0.05/kWh — daily electricity exceeds revenue.
Hardware depreciation: a critical variable most calculators ignore. An S21 Pro purchased at $5,000 has a useful life of 3-5 years. If you model 3-year depreciation: $5,000 / 1,095 days = $4.57/day hardware cost. Add to electricity: total daily cost = $4.21 + $4.57 = $8.78/day. At $0.45/day revenue, this is deeply unprofitable. Now you understand why mining requires either: very cheap electricity (<$0.03/kWh), much higher BTC prices, or much lower hardware costs (refurbished).
Variable modeling: difficulty grows as more hashrate comes online — historically 50-100% per year during bull cycles. Pool fees: typically 1-2% of revenue. Overhead: cooling electricity, internet, facility rent/amortization add 20-30% to direct electricity costs. Maintenance reserve: 5-10% of hardware value per year for replacements. Tax: in most jurisdictions, mined BTC is income at fair market value on the day mined — adds income tax burden on top of capital gains treatment.
- ✓Daily revenue = (Hashrate / Network Hashrate) × Daily Rewards × Price
- ✓Electricity = Watts × 24h × kWh rate — typically dominant ongoing cost
- ✓Depreciation: hardware cost ÷ useful life — often equals electricity cost
- ✓Difficulty growth: 50-100%/year in bull cycles — reduces revenue over time
- ✓Overhead: cooling, internet, facility adds 20-30% to electricity costs
- ✓Tax treatment: mined coins = income on mining date — create immediate tax liability
Break-Even Analysis and ROI Scenarios
Break-even price: at what BTC price does my operation break even? Formula: BE Price = Total Daily Costs / Daily BTC Production. Example: $10/day total costs, producing 0.0001 BTC/day → BE Price = $100,000/BTC. If BTC is below $100K, you're losing money. This metric tells you your BTC price risk exposure. Professional miners calculate their break-even price and ensure sufficient margin above it.
Dynamic modeling with spreadsheets: the correct approach uses monthly or quarterly projections. Variables to model: BTC price (multiple scenarios: base, bear, bull), difficulty growth (10%, 50%, 100%/year scenarios), electricity price changes, hardware degradation (efficiency typically drops 5-10%/year), market value of hardware (resale option). Google Sheets or Excel with multiple scenario tabs gives a much clearer picture than any online calculator.
Payback period analysis: the total time to recover hardware cost from net profits. Example: $10,000 hardware, $2/day net profit → 5,000-day (13+ year) payback. Obviously unacceptable. For mining to make business sense: typically target <18-24 month payback in bull scenarios, <36 months in base scenarios. If base scenario payback is 60+ months, the investment is speculative rather than business-rational.
- ✓Break-even price: Total Daily Costs ÷ Daily BTC Production
- ✓Target: payback <18-24 months in bull scenario, <36 months base case
- ✓Scenario modeling: run bear/base/bull cases — don't assume current prices hold
- ✓Difficulty growth: historically 50-100%/year bull, 10-20%/year bear
- ✓Resale value: hardware has residual value — factor into ROI calculations
- ✓Hash price metric: $/TH/day — industry standard profitability benchmark
Frequently Asked Questions About Mining Profitability
Skip the Math — Start Earning XRP Today
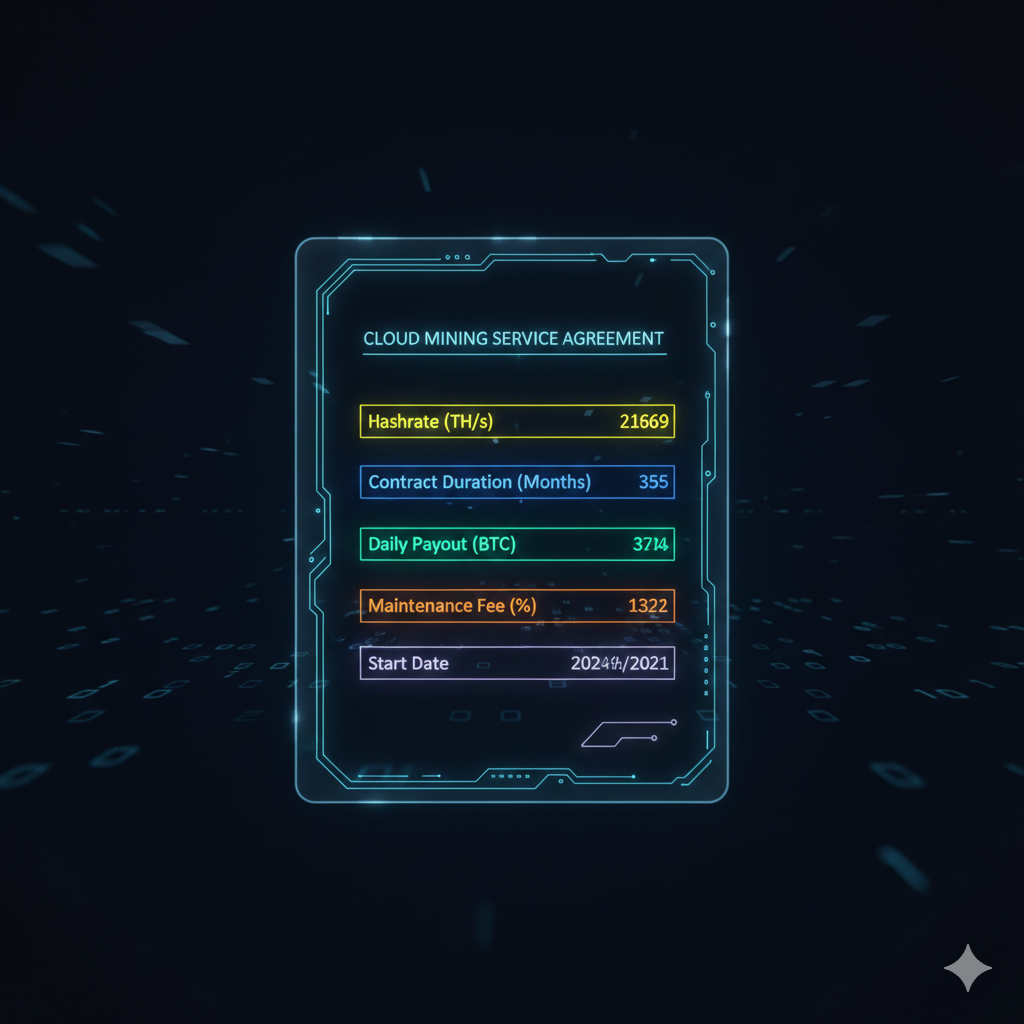
Complex mining ROI calculations are why cloud mining exists. MineXrpOnline handles the hardware, electricity, and operations. You earn daily XRP with predictable returns.
Calculate Your XRP Returns